Scientific Overview
The Wu et al. (2021) breast cancer Visium dataset was reanalysed by integrating RNA counts, spatial coordinates, H&E histology and source pathology annotations. Six specimens (four triple-negative, two ER-positive) contributed 15,399 retained spots and 18,714 shared genes. Unsupervised transcriptional analysis and six curated expression programmes revealed spatially heterogeneous epithelial, immune, stromal, hypoxia- and proliferation-associated patterns. Focused pathology comparisons identified a necrosis-proximal hypoxia gradient (Spearman rho = -0.348), lymphocyte-centred immune gradients in three tumours, and distinct proliferation and ECM expression in DCIS versus mixed invasive-associated tissue. Across specimens, 127 variance-selected genes showed recurrent positive spatial autocorrelation; pathway overrepresentation implicated immune recognition, matrix organisation and translation-associated processes. Findings describe multicellular tissue-associated expression, not individual-cell identities or causal mechanisms.
Six Breast Tumours Provide Distinct Histopathological Contexts
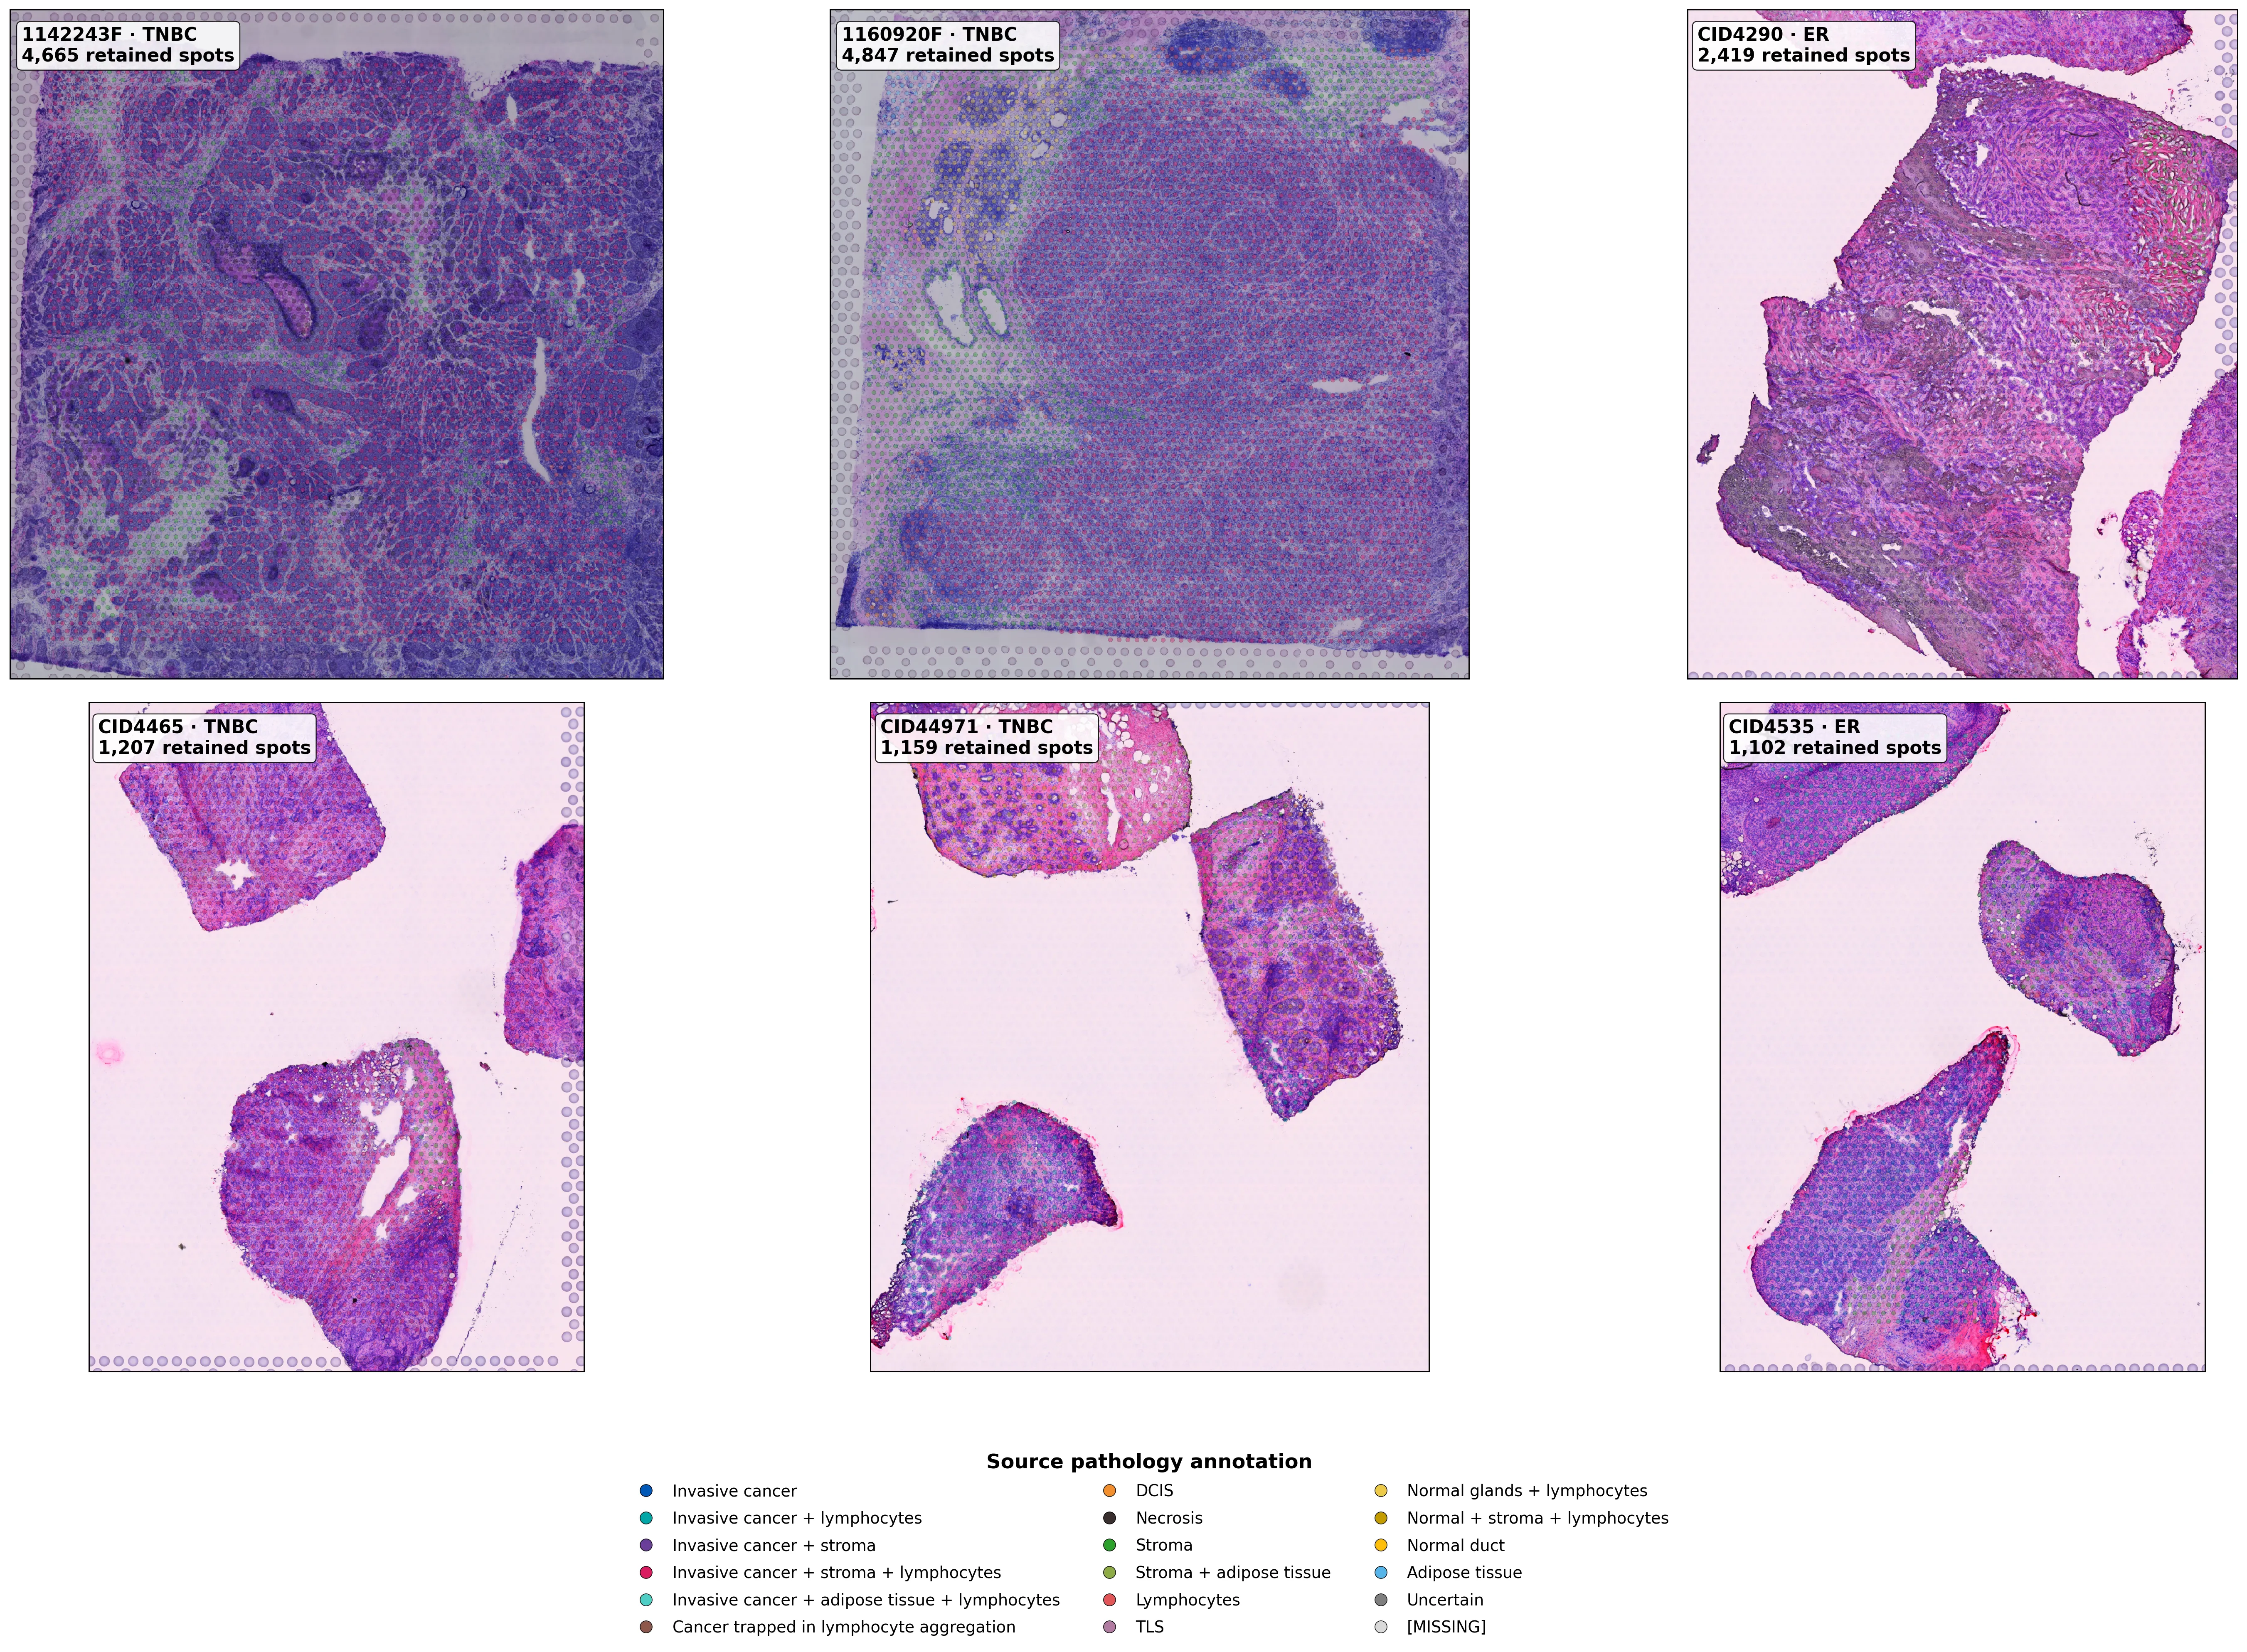
The six specimens were 1142243F, 1160920F, CID4290, CID4465, CID44971 and CID4535. All 15,611 initial expression barcodes matched spatial and metadata records. Harmonisation across source matrices yielded 18,714 shared gene symbols; removal of 202 artefact-labelled and ten out-of-tissue spots retained 15,399 (98.64%). The sections differed anatomically: 1142243F contained 568 necrosis-labelled spots, 1160920F had 186 lymphocyte-labelled spots, and CID44971 contained 273 DCIS and 317 “Invasive cancer + lymphocytes” spots. These were tumour sections, without independent healthy controls. The contrasting histological regions provided reference compartments for the spatial analyses.
Figure 1. Six primary breast cancer H&E sections with source pathology annotations, tumour subtypes and retained Visium spots.
Transcriptional Clusters Correspond Unequally With Histopathology
Within each tumour, counts were normalised to 10,000 per spot and log1p-transformed; 2,000 highly variable genes informed PCA and graph-based clustering. Pathology explained markedly different proportions of PC1 variation: eta-squared = 0.683 in CID44971, 0.437 in 1160920F and 0.026 in 1142243F. The original representation generated six to ten Louvain clusters per specimen; cluster-pathology normalised mutual information reached 0.613 in CID44971 and 0.352 in CID4535. Thus, histological compartments corresponded to transcriptional structure to differing degrees across tumours.
PC1 also correlated with sequencing depth (absolute r approximately 0.546-0.943). Alternative square-root-centred preprocessing reduced median absolute PC1-depth correlation from 0.745 to 0.461 but did not consistently improve pathology association. The primary log-normalised results were retained, with this technical sensitivity recognised in their interpretation.
Figure 2. Primary UMAP embeddings and specimen-specific Louvain clusters across all six tumours.
Figure 3. The same transcriptional clusters mapped to original Visium array coordinates.
Cluster Markers Define Distinct Molecular Programmes
Descriptive cluster-associated expression included epithelial markers KRT19, TACSTD2 and CD24; immune markers IGKC, IGLC2, CD74 and CCL19; and ECM markers COL1A1, COL3A1, POSTN and DCN. Hypoxia-associated genes NDUFA4L2, NDRG1 and VEGFA, alongside proliferation-related STMN1 and CENPW, motivated focused tissue comparisons. These were descriptive marker patterns, not inferential differential-expression calls.
Figure 4. Specimen-specific expression of representative cluster-associated marker genes.
Six curated, within-tumour standardised signatures summarised epithelial, T-cell-associated, B/plasma-associated, stromal ECM, hypoxia-associated and proliferation-associated transcription. Their cluster-level distributions differed across tissue regions, connecting unsupervised transcriptional structure to interpretable programmes.
Figure 5. Cluster-level means of six curated expression programmes in each tumour.
All six programmes displayed positive local spatial-neighbour correlations in every specimen. Median correlations were highest for B/plasma-associated expression (0.701), stromal ECM (0.651) and T-cell-associated expression (0.622), followed by epithelial (0.616), proliferation (0.492) and hypoxia (0.388). These recurrent spatial patterns motivated examination of their relationships with pathology-defined landmarks.
Figure 6. Within-tumour local spatial-neighbour correlations for six programmes across six specimens.
Hypoxia-Associated Expression Decreases Away From Necrosis
In 1142243F, necrosis-labelled spots showed higher median hypoxia-associated scores than other spots (+0.486 versus -0.149). Among 4,097 non-necrotic spots, median scores declined with distance to the nearest necrotic spot: +0.389 at <2, -0.088 at 2-<5, -0.225 at 5-<10 and -0.286 at >=10 Visium array units (Spearman rho = -0.348). Linear log-depth residualisation yielded rho = -0.346, preserving the observed direction. This specimen-specific gradient links hypoxia-associated RNA expression to necrotic histology without directly measuring oxygen availability.
Figure 7. Necrosis-labelled tissue and hypoxia-associated expression overlaid on H&E histology in 1142243F.
Figure 8. Non-necrotic spot-level hypoxia scores and distance-band medians relative to necrosis.
Immune-Associated Gradients Extend From Lymphocyte-Rich Regions
The recurrent spatial organisation of immune signatures led to distance analyses centred on spots annotated exactly as “Lymphocytes” in 1160920F (186 anchors), CID44971 (81) and CID4535 (69). T-cell-associated expression declined with distance in all three specimens (rho = -0.306, -0.242 and -0.228); B/plasma-associated correlations were -0.358, -0.525 and -0.334, respectively. In 1160920F, median T-cell and B/plasma scores changed from +1.342 and +0.936 within lymphocyte-labelled regions to -0.264 and -0.304 at >=10 array units. Epithelial-associated expression showed the opposite contrast (-1.094 versus +0.245).
The strongest B/plasma distance association occurred in CID44971 (rho = -0.525), indicating specimen-dependent immune spatial profiles. All six T-cell and B/plasma distance associations remained negative after linear depth residualisation. Because anchor locations were already classified as lymphocyte-rich, these findings quantify the extent and variation of surrounding immune-associated expression rather than independently demonstrating immune-cell infiltration.
Figure 9. T-cell- and B/plasma-associated spatial expression relative to annotated lymphocyte-rich regions in three tumours.
Figure 10. Immune programme scores across distance bands, with spot-level Spearman correlations for three specimens.
Dcis And Mixed Invasive-Associated Regions Differ In Proliferation And Ecm Expression
In CID44971, 273 DCIS spots were compared with 317 spots labelled “Invasive cancer + lymphocytes”. DCIS showed higher proliferation-associated expression (median difference +0.593) but lower stromal ECM (-1.227), T-cell-associated (-0.361) and B/plasma-associated (-0.341) scores. Epithelial and hypoxia-associated median contrasts were approximately +0.007 each. Despite differing median library sizes (15,644 versus 10,070 counts), proliferation and ECM contrasts retained their directions after linear depth residualisation (+0.461 and -1.113). These differences describe histological tissue mixtures, not intrinsic molecular differences between isolated malignant DCIS and invasive cells.
Figure 11. Proliferation and stromal ECM signatures mapped against DCIS and mixed invasive-associated histology in CID44971.
Figure 12. Descriptive DCIS-minus-mixed programme contrasts before and after log-depth residualisation.
Recurrent Spatial Genes Support Immune And Stromal Organisation
Beyond curated signatures, Moran's I was calculated for 800 variance-selected genes per tumour using a six-neighbour spatial graph, 199 label permutations and within-specimen Benjamini-Hochberg correction. Positive spatial autocorrelation at q < 0.05 occurred in 4,678/4,800 gene-tumour tests, a result specific to this variance-selected universe and permutation framework. Of these, 127 genes met the spatial screen in all six specimens; 92 remained after a descriptive |expression-depth correlation| <0.4 filter in every tumour. Recurrent genes included IGHG3 (median Moran's I 0.566), IGLC3 (0.471), COL1A1 (0.375), APOE (0.357), C1QA (0.352), COL3A1 (0.328) and HLA-DPB1 (0.302). Their immune, myeloid and ECM associations complemented the pathology-anchored observations.
Figure 13. Moran's I for 25 selected recurrent spatial genes across six tumours.
Pathway Enrichment Links Spatial Genes To Immune Recognition And Matrix Organisation
GO Biological Process and Reactome overrepresentation was tested among each tumour's top 80 Moran's-I genes against its 800-gene tested background. MHC-II antigen presentation was enriched in 1142243F (q = 0.00278), alongside ECM organisation (q = 0.0165). CID4535 showed Reactome ECM organisation and interferon-gamma signalling (both q = 0.0129). Scavenger-receptor ligand uptake recurred in three tumours; translation and ribosomal terms predominated in 1160920F and CID44971, frequently reflecting overlapping gene sets. These enrichments identify biological associations among spatially structured transcripts, not measured pathway activity.
Figure 14. GO and Reactome overrepresentation across specimens, distinguishing significance status and enrichment magnitude.
Conclusion
Across six primary breast tumours, immune and ECM-associated transcription formed recurrent spatially structured compartments, while local histology revealed distinct molecular relationships. Hypoxia-associated scores decreased away from necrosis in one tumour (rho = -0.348); T-cell- and B/plasma-associated scores declined away from lymphocyte-rich regions in three; and DCIS-associated tissue showed higher proliferation but lower ECM expression than mixed invasive-associated regions (+0.593 and -1.227). Recurring immune, myeloid and ECM genes, together with pathway enrichment, independently complemented these programme-level observations. The investigation therefore resolves both shared and specimen-specific features of breast cancer molecular architecture at multicellular Visium-spot resolution.