Scientific Overview
Does colorectal cancer (CRC) have a reproducible gut microbial signature beyond overall diversity? We analysed 2,138 eligible stool metagenomes from ten countries (1,056 healthy, 185 adenoma, 897 CRC), encompassing 2,543 metagenomic species pangenome (MSP) features and 378 functional modules. Cross-study estimates showed no consistent CRC association with richness or Shannon diversity, yet Bray-Curtis composition differed modestly in discovery (source-project-adjusted R² = 0.00428; p = 0.001) and external cohorts (cohort-adjusted R² = 0.00472; p = 0.001). Discovery identified 268/656 microbial features and 185/325 functional modules at false-discovery rate (FDR) < 0.05. Prominent signals included increased relative representation of Parvimonas micra, Peptostreptococcus stomatis and Gemella morbillorum and predicted pathways involving tryptophan and propionate metabolism. External testing supported selected microbial detection associations, but not corresponding CLR abundance or tested functional-pathway associations. Together, the findings distinguish community composition, individual microbial signatures and inferred metabolic potential as complementary levels of CRC-associated variation.
Defining The Study: Which Comparisons Are Supported By A Multinational Resource?
We first established clinical eligibility and source-project provenance to distinguish disease associations from differences among contributing datasets. Of 2,340 original samples, 202 were excluded under primary-analysis criteria, leaving 2,138 across 15 source projects and ten countries. The harmonised matrices contained MSP and functional signals, not raw sequencing counts newly processed here. Missing feature-sample combinations were encoded as zero during the original dataset harmonisation and interpreted as nondetections, subject to sequencing and reference-catalogue detection limitations.
Figure 1. Healthy, adenoma and CRC sample counts by source project. Source: Main_Figure_01_Clinical_Composition.webp.
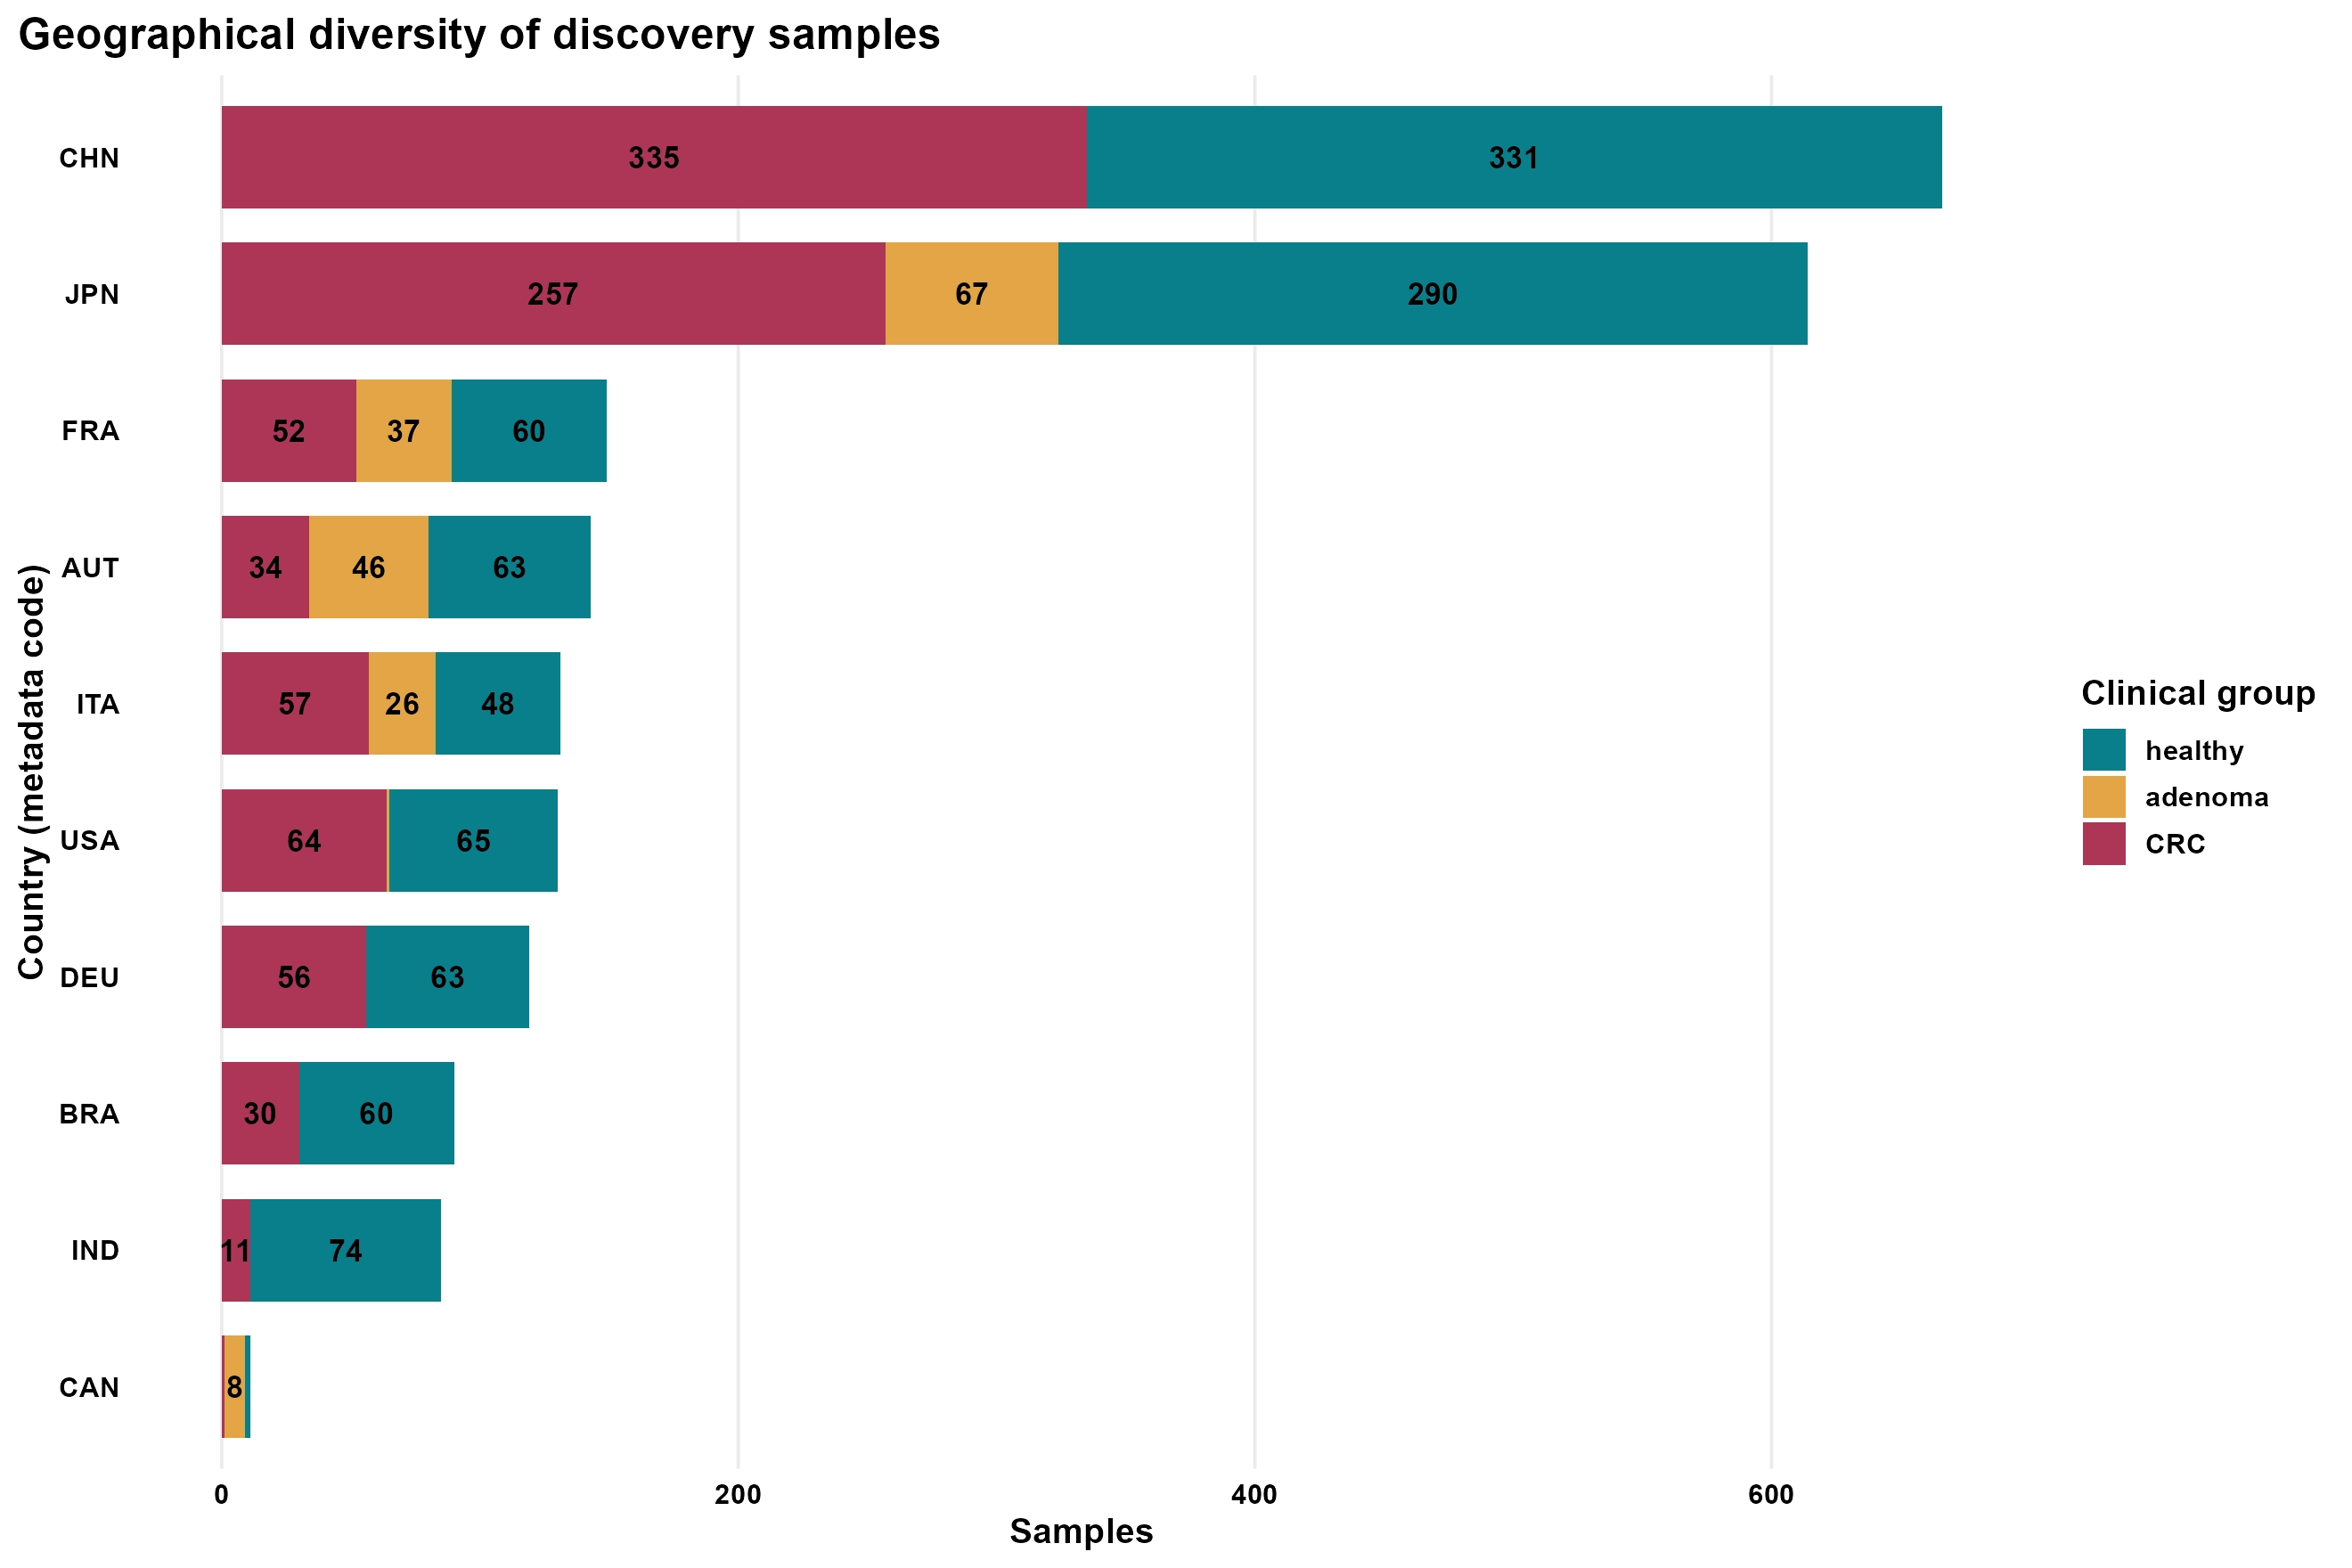
China and Japan contributed the largest sample collections, complemented by European, American and other Asian cohorts. This international coverage motivated source-project-aware statistical models rather than pooled comparisons alone.
Figure 2. Geographic distribution of eligible samples across ten countries. Source: Main_Figure_17_Discovery_Samples_by_Country.webp.
First Question: Does Crc Consistently Alter Overall Microbial Diversity?
We examined detected-MSP richness and Shannon diversity because disease-associated changes might involve community complexity, individual taxa or both. Random-effects analysis yielded a CRC-minus-healthy richness difference of +6.15 MSP features (95% CI -15.07 to +27.37; p = 0.533; I² = 75.1%) and a Shannon difference of -0.00032 (p = 0.994). Neither endpoint showed a consistent cross-study association.
Figure 3. Sample-level richness distributions; inference derives from the study-aware analysis. Source: Main_Figure_02_Microbial_Richness.webp.
Figure 4. Shannon diversity distributions in healthy and CRC samples. Source: Main_Figure_03_Shannon_Diversity.webp.
Comparable aggregate diversity can conceal differences in microbial identity. We therefore asked whether community composition differed despite the weak alpha-diversity evidence.
Second Question: Does Crc Associate With Microbial Community Composition?
Using Bray-Curtis dissimilarity on sample-total-normalised MSP profiles, the primary discovery comparison included 1,868 CRC/healthy samples from 13 projects containing both groups. Source-project-adjusted PERMANOVA detected a CRC association (R² = 0.004276, equivalent to 0.428% of dissimilarity variation; F = 8.590; permutation p = 0.001), while project identity accounted for 7.275%. Adjustment for age, sex and body mass index (BMI) in 1,637 complete cases from 11 projects retained the association (R² = 0.004011; p = 0.001).
Figure 5. Bray-Curtis principal-coordinate ordination: substantial healthy-CRC overlap accompanies the small overall effect. Source: Main_Figure_04_Bray_Curtis_Ordination.webp.
Ten of 13 projects showed FDR-significant CRC-associated PERMANOVA results. Four also showed significant within-group dispersion differences, so their PERMANOVA signals cannot be attributed exclusively to shifted community centroids. The largest project-specific R² came from only 18 samples, including six CRC cases, and warrants proportionate interpretation.
Figure 6. Project-specific PERMANOVA R² and multivariate-dispersion evidence. Source: Main_Figure_05_Project_Beta_Diversity.webp.
These results demonstrate a small, detectable community-level association, prompting identification of the taxa underlying more specific CRC-related differences.
Third Question: Which Microbial Features Are Associated With Crc?
Adjusted centred-log-ratio (CLR) analysis tested 656 prevalent MSP features; 268 met Benjamini-Hochberg FDR < 0.05. CRC-associated higher CLR estimates included P. micra (+1.636), P. stomatis (+1.439), Allisonella pneumosinta (+1.265), G. morbillorum (+1.242), Porphyromonas asaccharolytica (+0.996) and Fusobacterium animalis (+0.784). Lower estimates included Roseburia intestinalis (-1.275), Agathobacter faecis (-0.997), Hominilimicola fabiformis (-0.851) and Streptococcus salivarius (-0.729). CLR effects describe relative community representation, not absolute bacterial quantities.
Figure 7. Differential-abundance volcano plot of all 656 tested features, with 268 FDR-significant associations highlighted. Source: Main_Figure_06_Microbial_CLR_Volcano.webp.
We then examined 20 discovery-prioritised features across 11 source projects. All 20 met the reported random-effects meta-analysis FDR threshold, and 19/20 retained effect direction in leave-one-project-out summaries. Because prioritisation and synthesis drew on overlapping discovery data, this establishes within-resource consistency rather than independent replication.
Figure 8. Cohort-specific adjusted CLR effects for 20 prioritised taxa across 11 source projects. Source: Main_Figure_07_Cross_Study_Microbial_Association_Heatmap.webp.
Figure 9. Random-effects estimates and 95% confidence intervals for the 20 prioritised microbial features. Source: Main_Figure_08_Microbial_Random_Effects_Forest.webp.
At the individual-sample level, relative microbial profiles remained heterogeneous across both clinical groups; disease-associated effects should not be mistaken for uniform profiles or diagnostic separation. The descriptive heatmap uses prevalent named taxa rather than the 20 prioritised association features.
Figure 10. Relative abundance of annotated microbial taxa in representative healthy and CRC samples, with project and country annotations. Source: Main_Figure_09_Representative_Microbial_Profiles.webp.
Taxonomic differences raise a further question: do CRC-associated microbiomes also differ in their predicted biochemical capabilities?
Fourth Question: Which Microbial Functions Are Associated With Crc?
Of 378 source-defined functional modules, 325 were tested and 185 showed adjusted CRC associations at FDR < 0.05. Among 32 prioritised modules evaluated by cross-project random-effects models, 17 met the reported FDR threshold. Indole-3-propionic acid synthesis (MGB017) showed a positive meta-estimate (+1.285; FDR = 0.00246), as did propionate production through the acrylate pathway (MF0121; +0.865; FDR = 0.010). Tryptophan degradation (MF0009; +0.282; FDR = 0.036) contrasted with lower tryptophan biosynthesis potential (MGB005; -0.203; FDR = 0.00566). The butyrate-transferase module MF0116 was not significant in follow-up meta-analysis (+0.122; FDR = 0.129).
Figure 11. Predicted functional-module signals across representative discovery samples. Source: Main_Figure_10_Predicted_Functional_Profiles.webp.
Figure 12. Discovery and cross-project functional association estimates with 95% confidence intervals. Source: Main_Figure_11_Functional_Association_Forest.webp.
These associations concern inferred microbial metabolic potential, not measured indole-3-propionic acid, propionate, enzyme activity or metabolic flux. With functional variation established in the discovery resource, we next examined how prioritised signatures differed across healthy, adenoma and CRC clinical categories.
Fifth Question: How Do Signatures Differ Across Healthy, Adenoma And Crc Groups?
Five projects represented all three groups, providing 1,116 samples (481 healthy, 185 adenoma, 450 CRC). Among 20 selected microbial features, 2 were FDR-significant for adenoma versus healthy, 20 for CRC versus healthy and 16 for CRC versus adenoma. Among 12 selected functional modules, the corresponding counts were 5, 9 and 1; the sole significant CRC-versus-adenoma functional contrast involved MGB017.
Figure 13. Descriptive detection prevalence of selected common taxa across independent healthy, adenoma and CRC groups. Source: Main_Figure_12_Three_Group_Microbial_Detection.webp.
Figure 14. Adjusted CLR effect heatmap across the three clinical-group contrasts; asterisks indicate FDR < 0.05. Source: Main_Figure_13_Healthy_Adenoma_CRC_Association_Heatmap.webp.
CRC-related taxonomic signals were generally more pronounced than adenoma-versus-healthy associations, whereas some predicted functional differences appeared in adenoma samples. These cross-sectional comparisons identify group associations, not temporal transitions or disease progression. Their broader relevance required assessment outside the discovery resource.
Sixth Question: Is The Community-Level Association Detectable In External Cohorts?
Four newly sequenced external cohorts contributed 769 CRC/healthy samples: Czechia (59/46), Italy (86/59), US Nurses' Health Study II (14/448) and Turkey (18/39), giving 177 CRC and 592 healthy specimens. Cohort-adjusted PERMANOVA detected a small CRC association (R² = 0.00472; p = 0.001), similar to discovery. With age, sex and BMI adjustment (n = 728), R² was 0.00422 (p = 0.001). Three of four cohorts showed FDR-significant project-specific associations; NHSII, with 14 CRC cases, did not.
Figure 15. Discovery and external CRC-associated PERMANOVA R² values, with and without demographic adjustment. Source: Main_Figure_14_Community_Association_Effect_Sizes.webp.
This independent comparison supports a repeatable association at the community level, albeit accounting for less than 1% of overall Bray-Curtis variation. We therefore tested whether the same named microorganisms reproduced across profiling frameworks.
Seventh Question: Which Microbial Associations Reproduce Externally?
External MetaPhlAn 4 profiles permitted exact species-name matching for six discovery candidates. In the four-cohort demographically adjusted detection meta-analysis, P. micra had odds ratio (OR) 19.60 (95% CI 5.45-70.48), P. stomatis OR 12.58 (2.11-75.11), G. morbillorum OR 15.56 (2.47-98.12) and S. salivarius OR 0.581 (0.418-0.806); each met FDR = 0.0306. The remaining two tested species did not meet the same threshold.
Figure 16. Four FDR-significant external microbial detection odds ratios and 95% confidence intervals. Source: Main_Figure_15_External_Taxonomic_Validation.webp.
Detection and abundance are distinct endpoints. None of the six species had FDR-significant external CLR abundance replication. NHSII contained no detected CRC cases for the three oral-associated organisms, despite finite bias-reduced logistic estimates. Excluding NHSII preserved expected directions but left 0/6 detection associations FDR-significant across the other three cohorts. The supported claim is therefore four-cohort detection association, not uniform abundance replication across all populations.
Eighth Question: Do Functional Signatures Reproduce Externally?
External HUMAnN 3.6 profiles used pathway definitions different from the discovery module catalogue. Two biologically corresponding pathways were defensibly tested. Propanoate fermentation via acrylate (PWY-5494) showed meta-estimate +0.394 (95% CI -0.635 to +1.423; p = 0.310; FDR = 0.349), while D-galactose degradation I (PWY-6317) showed -0.183 (-0.710 to +0.344; p = 0.349; FDR = 0.349). Neither was independently significant. Other discovery modules, notably MGB017, lacked sufficiently equivalent external annotations for direct quantitative testing.
Figure 17. External adjusted pathway effects and 95% confidence intervals for two biologically corresponding functional pathways. Source: Main_Figure_16_External_Functional_Validation.webp.
Integrated Interpretation
The evidence resolves three distinct aspects of the CRC-associated microbiome. First, stable cross-study differences in overall richness or Shannon diversity were not demonstrated, yet compositional variation was detectable in both discovery and external data. Second, specific taxa showed stronger discovery associations, with selected oral-associated organisms also demonstrating external detection associations. Third, predicted metabolic potential differed across CRC clinical groups, but tested pathway effects were not independently confirmed. These levels of evidence are complementary, not interchangeable: CLR estimates reflect relative representation, functional modules represent predicted capacity and significant community associations do not establish diagnostic classification or microbial causation.
Conclusion
Multi-cohort shotgun metagenomics identified CRC-associated taxonomic and inferred functional patterns not captured by broad alpha-diversity metrics. A modest compositional association reproduced across datasets, while selected microbial detection signatures showed evidence of external consistency under the complete four-cohort model. Taxonomic abundance and functional-pathway findings were less reproducible, defining specific candidates for subsequent targeted biological and diagnostic investigation. The project integrates ecological profiling, candidate-feature discovery, source-project-aware inference, adenoma comparisons and external validation into an evidence-led characterisation of the colorectal cancer gut microbiome.
Supplementary Figures
Additional supplementary analysis
Supplementary Figure 4. Relative abundance among detected samples.