Scientific overview
Why do cancer cell lines, including those from the same lineage, respond differently to a compound? We integrated GDSC2 viability AUC with Sanger Cell Model Passports annotations, RNA expression, proteomics, copy number and recorded mutation events. We moved from lineage-level variation to molecular prediction, explainable AI, GDSC2-PRISM concordance and a targeted MAPK investigation. Four-modality models modestly improved prediction over RNA alone; TP53 contributed strongly to Nutlin-3a prediction, while SLFN11 associations with topoisomerase I inhibitors recurred across assays. The MAPK signal was strongest in colorectal models; STRING neighbourhood features added no consistent predictive benefit. These are preclinical associations, not patient outcomes or validated therapies.
Establishing the data and the biological question
Within a given drug screen, lower fitted AUC generally represents greater viability suppression over the tested concentration range. Different drugs' raw AUCs cannot be ranked as comparable potency because assay ranges differ. We therefore retained distinct drug IDs and evaluated responses within each screen. The central sequence of questions was whether cancer lineage explains response, whether molecular variation adds predictive information, and whether those molecular predictors have coherent biological interpretations.
GDSC2 provided 242,036 records, 969 models and 295 drug IDs. Sanger identifiers linked model metadata and molecular assays. Coverage included approximately 944 RNA, 944 proteomic, 961 CNV and 951 mutation-summary models; 912 had RNA, proteomics and CNV jointly. The original feature universe comprised 41,143 RNA genes, 8,449 proteins, 769 CNV and 562 mutation-event features before fold-wise selection. An integrated modelling cohort contained 814 lines; the definitive internal benchmark used 569 original-training lines. A mutation-data record indicates coverage, not a confirmed functional mutation. Tumour-only counts differed slightly between analyses (881 versus 883) because inclusion rules varied; denominators remain analysis-specific.
Figure 1. GDSC2-linked RNA, proteomic, CNV and mutation-data availability, including overlapping assay coverage. Availability does not imply alteration presence. Source: 01_multiomics_coverage.webp.
Lineage structures response but does not explain everything
We first compared cancer-lineage AUC distributions separately for each drug using Kruskal-Wallis tests and Benjamini-Hochberg correction. 287/295 drugs met FDR < 0.05, demonstrating widespread experimental heterogeneity, not universal clinical selectivity. Large lineage-associated effect sizes (ε²) included vorinostat 0.427, trametinib 0.412, PD0325901 0.400, refametinib 0.374 and SCH772984 0.354. Their convergence around MEK/ERK inhibition motivated later pathway-focused questions.
Figure 2. Ranked between-lineage AUC heterogeneity, showing omnibus effect magnitude, drug coverage and adjusted significance; these are not clinical selectivity estimates. Source: 02_cross_cancer_heterogeneity.webp.
We then asked which cancer groups showed lower AUC relative to other lineages within the same drug. Across 1,438 contrasts involving breast, colorectal, pancreatic, NSCLC and SCLC, 76 met q < 0.05, rank effect ≥ 0.30 and lower focal median AUC. Colorectal models were enriched for lower MEK/ERK inhibitor AUC; SCLC showed notable ABT737 and navitoclax contrasts. NSCLC and SCLC were never pooled.
Figure 3. Cancer-drug enrichment bubble matrix. Colour and circle size encode distinct statistical properties; blanks are undisplayed comparisons, not confirmed null findings. Drug IDs remain distinct. Source: 03_drug_cancer_enrichment.webp.
Substantial response spread remained within lineages, including SN-38 in selected haematological cancers, docetaxel in breast and colorectal cancer, and dabrafenib in melanoma. This residual variation justified asking which molecular features distinguish cell lines beyond a cancer label.
Figure 4. Within-cancer drug-response interquartile ranges (IQR). These describe variation but do not establish its molecular cause. Source: 04_within_cancer_variability.webp.
Molecular prediction: RNA first, then four omics
For 15 high-coverage drugs, we trained RNA-based regression models, including XGBoost, Random Forest and ElasticNet, against training-derived cancer-mean and population-mean baselines. Grouped train/validation/test partitions and train-only feature selection were used. Initially, RNA models beat the cancer-mean test MAE for 14/15 drugs; median MAE was approximately 0.068, median R² 0.225 and median Spearman ρ 0.478. Camptothecin reached an initial R² near 0.58. Because these historical test results were subsequently inspected during development, they are exploratory rather than an untouched final holdout.
Figure 5. Historical held-out RNA prediction versus training-derived cancer-mean baseline, shown as paired MAE values. Source: 05_rna_prediction_vs_baseline.webp.
We next asked whether proteomics, mutations and CNV added information beyond RNA. The authoritative Phase 5B analysis used 569 original-training cell lines, 3 × 4 patient-grouped cross-validation, identical held-out observations and fold-local feature selection, scaling and imputation. The drug panel and model settings were fixed for this comparison.
| Representation | Mean MAE | Median R² |
|---|---|---|
| RNA + proteomics + CNV + mutations | 0.06601 | 0.23642 |
| RNA + genomic features | 0.06678 | 0.20348 |
| RNA only | 0.06826 | 0.19809 |
| Cancer-mean baseline | 0.07102 | 0.09777 |
| Population-mean baseline | 0.07925 | −0.00449 |
The four-modality model reduced mean MAE by 0.00225 AUC units (3.3%) versus RNA alone. This is a modest selected-panel gain, not universal superiority.
Figure 6. Matched, fold-local multi-omics predictive benchmark. Mean MAE summarises the selected drugs; lower values are better. Source: 06_multiomics_benchmark.webp.
The advantage was drug-dependent: 13/15 drug IDs improved, led by Nutlin-3a (+0.01055 MAE; 12/12 folds) and PD0325901 (+0.00660; 11/12). Camptothecin gained only 0.00056 (6/12 folds), while MG-132 and palbociclib slightly worsened. The descriptive drug-bootstrap interval for the average paired gain was 0.00102-0.00382, but chosen drugs and overlapping CV folds do not provide independent population replication.
Figure 7. Drug-level MAE difference (RNA minus all-four-omics); positive values favour integration. Repeated folds are not independent replicates. Source: 07_drugwise_multiomics_gain.webp.
Explaining when molecular information matters
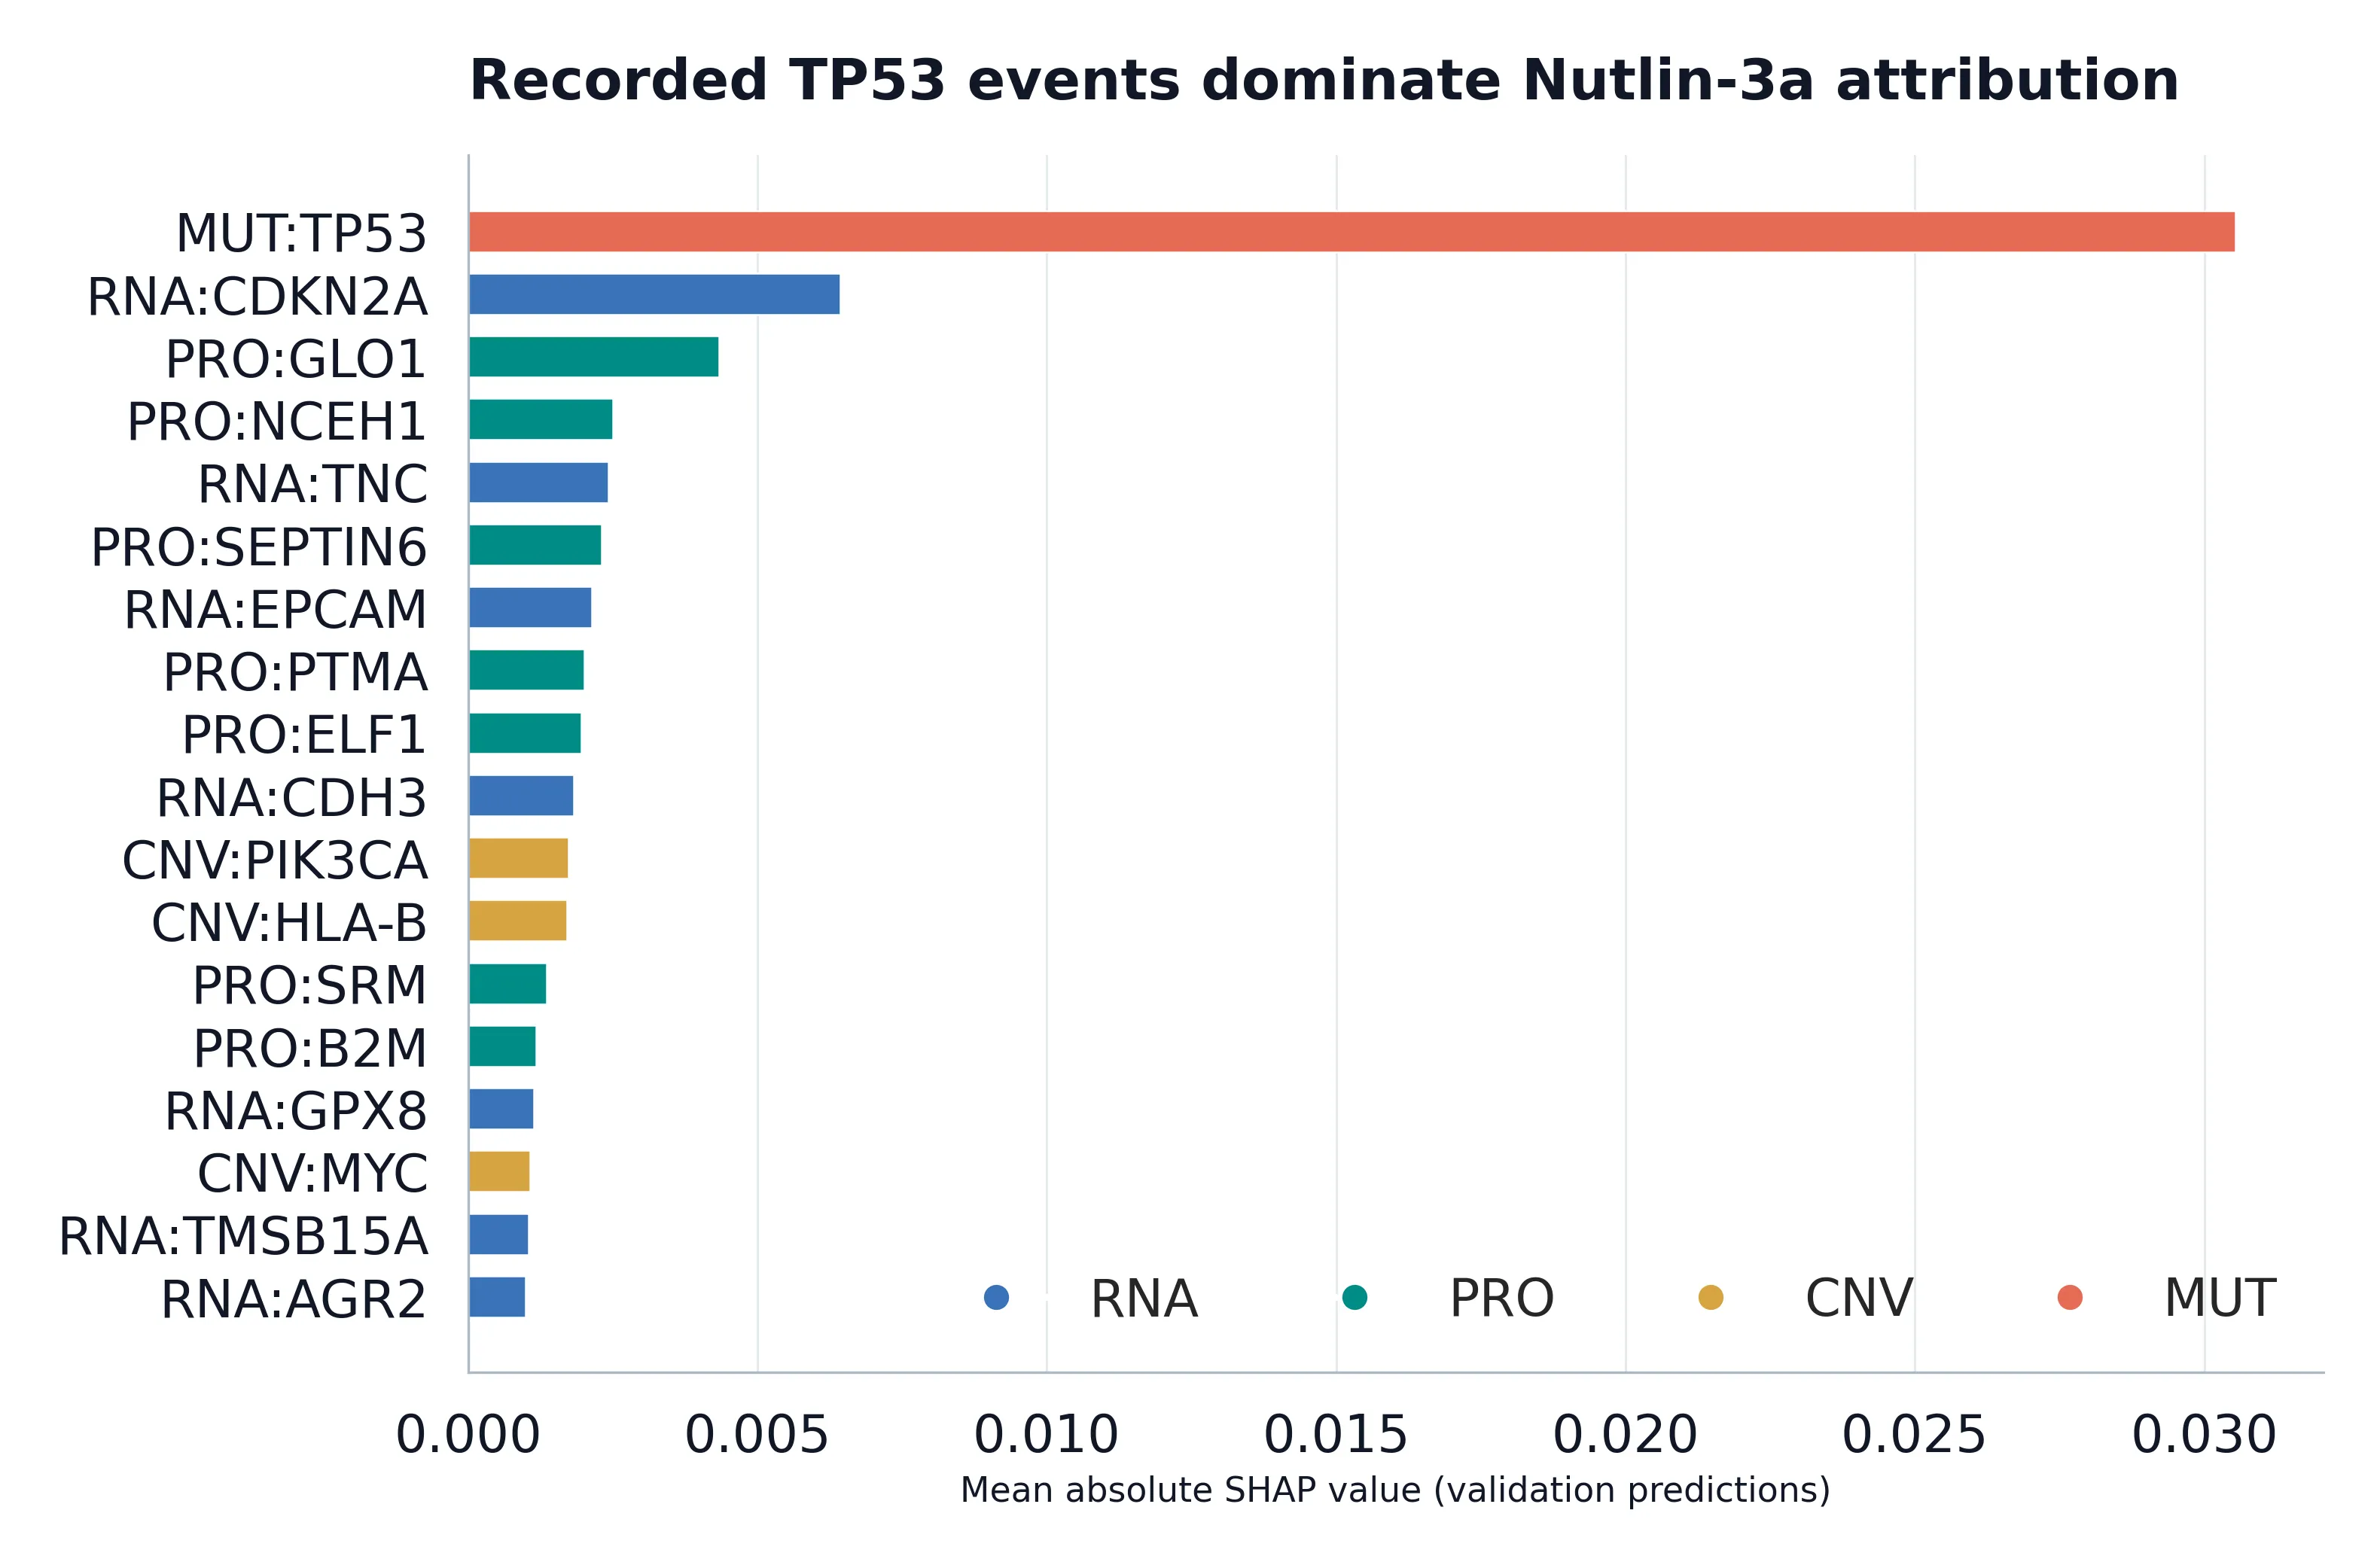
Nutlin-3a inhibits the MDM2-p53 interaction. Its RNA-only out-of-fold MAE was approximately 0.04171, compared with 0.03164 using genomic features and 0.03116 with all four modalities. SHAP ranked the recorded TP53 mutation event as the dominant predictor, with mutation information also important in modality perturbation. The alignment with p53 pharmacology makes this a strong biological positive control. However, recorded events are not confirmed functional TP53 loss-of-function variants, and SHAP indicates model attribution, not causation.
Figure 8. Nutlin-3a mean absolute SHAP attributions across molecular modalities, led by recorded TP53 events. Attribution is not causal evidence. Source: 08_nutlin_tp53_shap.webp.
Camptothecin presented a different pattern: little incremental multi-omics gain, but SLFN11 RNA expression repeatedly emerged as an informative feature. Since SLFN11 is implicated in replication-stress responses, we tested associations for three topoisomerase I inhibitors in GDSC2 and PRISM, adjusting partial-rank analyses for cancer category and RNA source.
| TOP1 inhibitor | GDSC2 adjusted ρ | PRISM adjusted ρ |
|---|---|---|
| Camptothecin | −0.414 | −0.231 |
| Irinotecan | −0.444 | −0.333 |
| Topotecan | −0.457 | −0.331 |
All principal associations retained negative directions and passed the reported multiple-testing correction. Higher SLFN11 expression corresponded to lower experimental AUC; selected melanoma, NSCLC and breast within-cancer analyses also supported the relationship. This is the strongest cross-assay biological finding, consistent with established SLFN11 biology rather than a newly discovered mechanism.
Figure 9. Cancer- and RNA-source-adjusted SLFN11-TOP1 inhibitor associations in GDSC2 and PRISM. Shared cell lines limit independent-validation claims. Source: 09_slfn11_crossplatform.webp.
The assays were not interchangeable. Shared-cell-line response correlations varied by provisional compound match: trametinib ρ ≈ 0.651, topotecan 0.558, selumetinib 0.511, irinotecan 0.489, docetaxel 0.467 and camptothecin 0.334. Chemical-structure matching remains unverified, and the platforms include overlapping cell lines; this is cross-platform concordance, not external validation in unseen models.
Figure 10. Compound-dependent GDSC2-PRISM response concordance across shared cell lines and provisional compound matches. Source: 10_gdsc_prism_concordance.webp.
MAPK inhibition: from shared enrichment to a colorectal-weighted signature
The lineage analysis identified lower-AUC enrichment for several MEK/ERK inhibitors in colorectal and pancreatic models, including SCH772984, PD0325901, selumetinib, refametinib and ulixertinib. Twelve drug IDs were enriched in at least two focus organs, ten involving pancreatic carcinoma. This suggested a useful comparative question, but enrichment relative to other cancers neither establishes equal absolute response nor proves shared pathway dependency.
Figure 11. Within-drug colorectal and pancreatic MEK/ERK inhibitor enrichment. Relative lower AUC does not establish clinical vulnerability. Source: 11_crc_pancreatic_mapk_enrichment.webp.
We next evaluated MAPK-related RNA, proteomic, CNV and mutation features in 270 matched models and 1,815 observations across seven drug IDs. Of 1,920 within-cancer association tests, 52 met global FDR < 0.05; nine significant target-cancer associations were reported, all in colorectal models. None of the pancreatic target-cancer associations passed this threshold. Selected colorectal signals included BRAF copy-number associations with selumetinib (ρ ≈ −0.567, q = 0.0124) and trametinib (ρ ≈ −0.493, q = 0.0396), without an established copy-number mechanism.
Figure 12. Selected MAPK RNA, CNV and mutation-response associations. Continuous correlations and mutation median differences have different scales and meanings. Source: 12_mapk_molecular_associations.webp.
A six-gene transcriptional feedback score (DUSP4, DUSP6, SPRY2, SPRY4, ETV4, ETV5) was then evaluated. In colorectal models, higher score associated with lower AUC for refametinib (ρ = −0.530, q = 0.0128), SCH772984 (ρ = −0.473, q = 0.0341) and PD0325901 (ρ = −0.459, q = 0.0425). Related drugs showed directionally similar but not uniformly FDR-significant associations. This score is a transcriptional feedback proxy, not a measurement of phospho-ERK, pathway activity or oncogenic dependency.
Figure 13. Colorectal versus pancreatic MAPK feedback-score correlations by inhibitor, with significant colorectal signals distinguished. Source: 13_mapk_signature_associations.webp.
Could the score improve prediction beyond mutations? Phase 6D compared source-adjusted Ridge models in 58 original-training lines (36 colorectal, 22 pancreatic) using 3 × 4 patient-grouped CV. Mean MAE was 0.10628 for cancer/source, 0.10328 with mutation records, 0.10155 with the score, and 0.09958 with both. Adding the score beyond mutations improved mean MAE by 0.00370 across seven selected drug IDs. It improved all seven colorectal comparisons (notably refametinib +0.0190 and trametinib +0.0160) but worsened six of seven pancreatic comparisons. These correlated drug screens and small, post-selected groups support a colorectal-weighted predictive hypothesis, not proven tissue-specific biology; 0/203 cancer-expression interaction tests survived FDR correction.
Figure 14. Incremental out-of-fold MAPK-score prediction gain beyond mutations in colorectal versus pancreatic models. Positive values indicate lower MAE; cohort sizes are small. Source: 14_mapk_signature_prediction_context.webp.
Does a protein interaction network improve prediction?
We tested whether STRING v12.5 high-confidence physical-association neighbourhoods (145,814 edges, 14,403 genes; score ≥ 700) improved matched multi-omics models for three MEK/ERK inhibitors. Real-network MAE versus conventional multi-omics was 0.07127 vs 0.07134 for PD0325901, 0.09422 vs 0.09371 for refametinib and 0.06910 vs 0.06900 for SCH772984. The network representation showed no consistent improvement over baseline or shuffled labels. Because the shuffle was not degree-preserving, this result applies to the tested neighbourhood features, not to network biology or all graph models.
Figure 15. Matched conventional multi-omics, real-STRING and shuffled-network MAE comparisons across three inhibitors. No consistent network benefit was observed. Source: 15_ppi_model_evaluation.webp.
Scientific interpretation and boundaries
The analyses answer a connected sequence of questions. Lineage explains substantial drug-response structure, but within-lineage variation motivates molecular prediction. Multi-omics modestly improves prediction for most selected drugs, with large variation by pharmacological mechanism. TP53/Nutlin-3a illustrates genomic predictive value, while SLFN11/TOP1 inhibitors provides coherent cross-compound and cross-platform RNA associations. MAPK feedback transcription is associated with several colorectal MEK/ERK responses and adds exploratory predictive information; pancreatic findings and the tested PPI representation provide weaker evidence.
Additional exploratory work included a BRAF-event/dabrafenib melanoma contrast (median AUC difference ≈ −0.302, q ≈ 0.004), without confirmation of activating V600 variants. Hyperparameter optimisation and earlier repeated-CV experiments informed development, but the fold-local Phase 5B benchmark is the preferred internal comparison. Pancreatic-NSCLC drug-profile correlations differed between analyses (ρ ≈ 0.716 vs 0.066) because reference-centering and eligibility differed; neither is used as a stable similarity claim. No drug-repurposing candidate met a structure-verified, independently validated evidence standard.
Statistical methods included drug-specific Kruskal-Wallis and rank-based contrasts, Spearman/partial-rank associations, Benjamini-Hochberg correction and patient-grouped cross-validation, with MAE as the principal predictive metric. Critical limitations are iterative drug/signature selection, reused historical test outcomes, overlapping GDSC2/PRISM models, provisional compound matches, nonfunctional mutation-summary labels, small colorectal/pancreatic subgroups and correlated drug screens. Cross-validation controls fold-level leakage, not all post-selection optimism. Cell-line AUC does not measure clinical efficacy, and SHAP does not prove mechanism.
Conclusion
Cancer lineage strongly associates with in-vitro drug response but leaves molecularly predictable heterogeneity. Across 15 selected drugs, four-modality modelling improved average error modestly and outperformed RNA-only modelling for 13/15. TP53 dominated Nutlin-3a attribution, and SLFN11 showed concordant TOP1-inhibitor associations across GDSC2 and PRISM. A six-gene MAPK feedback score yielded a colorectal-weighted exploratory biomarker signal, whereas STRING-neighbourhood features added no consistent advantage. The work demonstrates explainable, context-dependent computational pharmacogenomics and generates testable hypotheses, without claiming causal mechanisms or validated treatment indications.