Scientific Overview
Does a transcript associated with poor survival in one cancer carry the same prognostic information in another? Conversely, might different survival-associated genes converge on shared biological programmes? We examined these questions across ten The Cancer Genome Atlas (TCGA) cohorts, integrating tumour gene expression and overall-survival follow-up from 4,718 patients with 1,519 recorded deaths. Cancer-specific genome-wide Cox regression was followed by cancer-aware pan-cancer modelling, effect-heterogeneity assessment, selected clinical adjustment, proportional-hazards diagnostics and repeated cross-validation. Directional over-representation analysis (ORA) and ranked gene-set enrichment analysis (GSEA) then linked gene-level associations to Hallmark and Reactome programmes.
Three findings organise the study. SERPINE1 displayed consistently adverse effect directions across cancers, whereas MET, STX1A, PGK1 and DKK1 illustrated cancer dependence or model-specific uncertainty. Transcriptomic features improved internal survival discrimination in some cancers, but not universally. Finally, proliferation, extracellular-matrix, mesenchymal and hypoxia-associated programmes recurred across cohorts while sometimes reversing prognostic direction. These findings concern associations in bulk-tumour RNA, not causal mechanisms or clinically validated biomarkers.
Defining The Patient-Level Survival Cohort
A reliable survival association first requires one interpretable expression-outcome record per patient. Of 12,591 initial clinical records, 6,578 belonged to the selected cancers; primary-case selection, specimen reconciliation and exclusion of invalid or zero-duration follow-up yielded 4,718 matched patients. The source expression resource contained 20,531 features and 11,069 columns, but neither multiple specimen columns nor individual genes were treated as independent patients. Cohorts comprised BRCA (1,081), COAD (432), GBM (151), HNSC (519), KIRC (531), LUAD (502), LUSC (493), OV (302), PAAD (177) and UCEC (530). Unequal cohort sizes meant unequal precision and discovery power, even before accounting for follow-up.
Figure 1. Patient availability across ten TCGA cohorts. Bars represent unique patients in the final matched analysis, with exact counts labelled.
We next examined observed deaths rather than assuming sample size alone determines survival-information content. Event counts were 151, 97, 119, 220, 175, 182, 212, 183, 93 and 87 in the above cancer order, totalling 1,519. Censoring and follow-up duration differ across diseases: the observed death fraction is not a fixed-time mortality probability and should not be read as a direct ranking of cancer prognosis.
Figure 2. Recorded deaths and censoring by cancer. Stacked bars display observed event status and cohort denominators, not adjusted survival probabilities.
Preparing Expression For Comparable Association Estimates
We used processed, approximately log-transformed and batch-normalised expression data, inspecting feature availability and identifier consistency rather than treating missing measurements as biological absence. Within each cancer, expression was standardised so Cox hazard ratios corresponded to a one-standard-deviation increase in that cohort's expression. This facilitates interpretation of estimated relative hazards, but does not harmonise tumour biology or eliminate confounding. Between approximately 17,489 and 20,187 identifiable genes entered the ranked pathway analyses per cancer. With the analysis population and exposure scale defined, we could test the first biological question: which transcripts associate with survival in each malignancy?
Genome-Wide Discovery: Distinct Cancer-Specific Association Landscapes
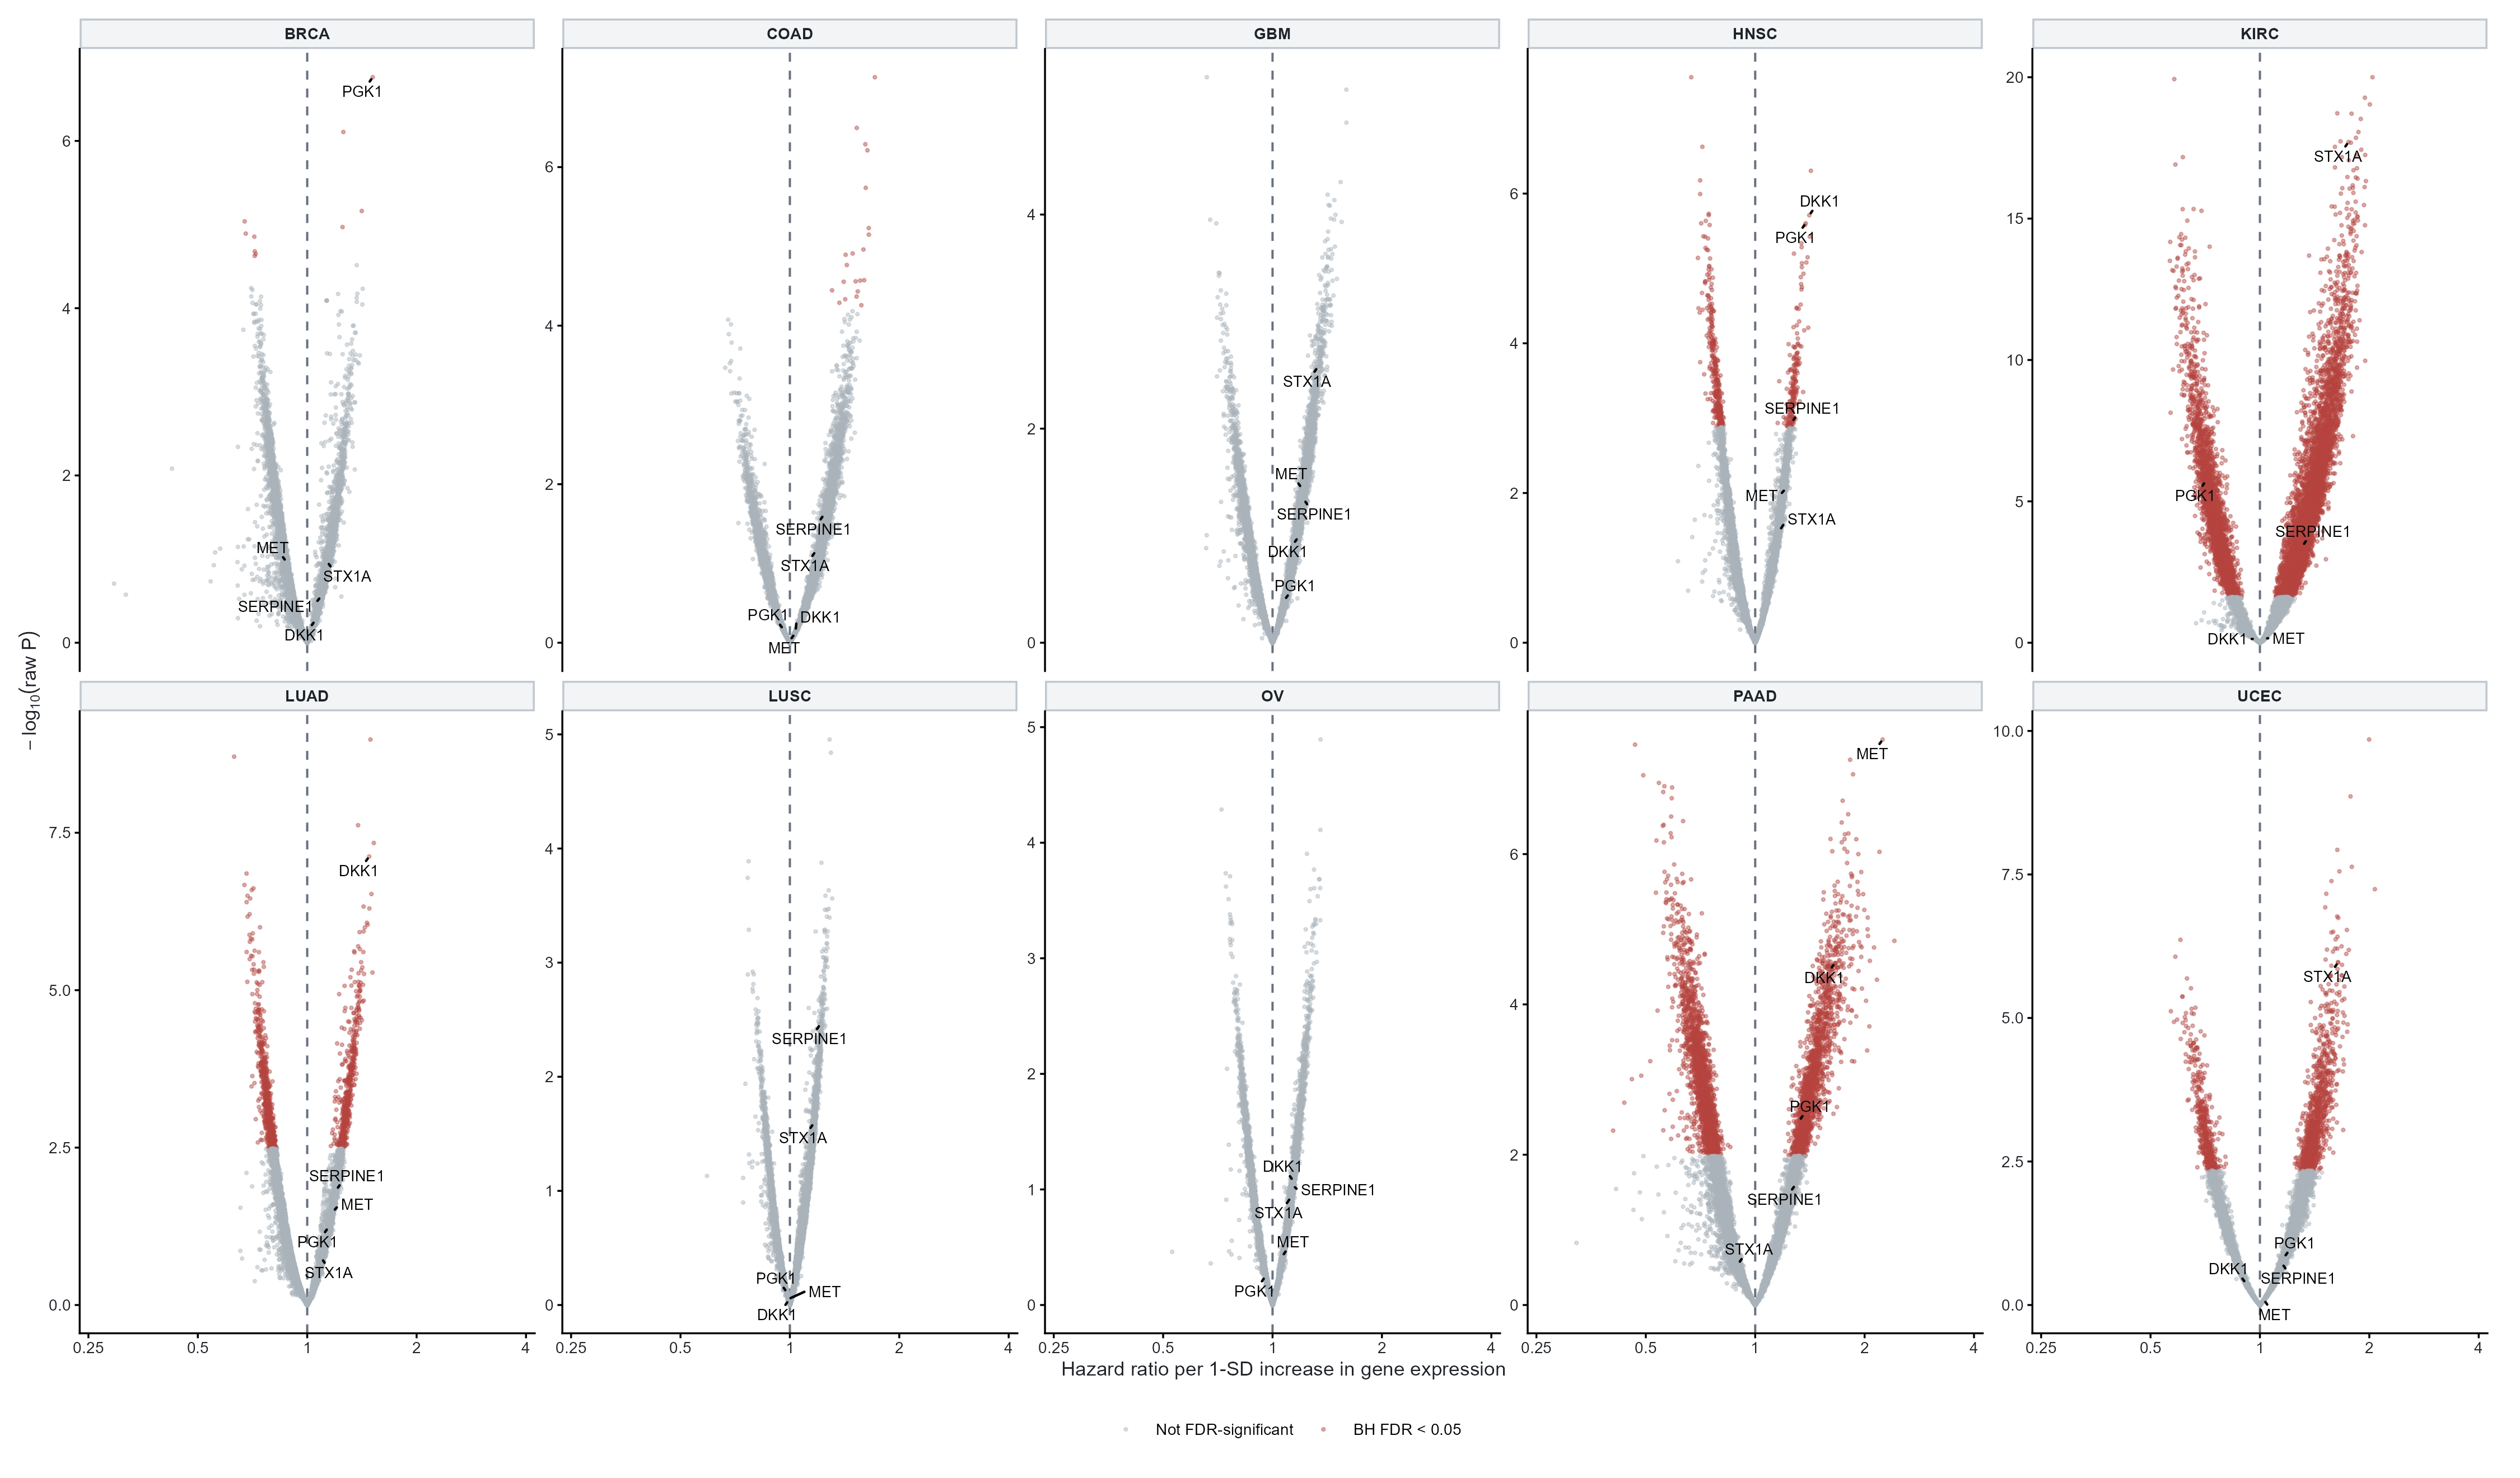
We fitted univariable Cox proportional-hazards models for eligible genes in each cancer and controlled within-cancer multiple testing using Benjamini-Hochberg false-discovery rates (FDR). Increasing expression with HR > 1 implied higher fitted hazard; HR < 1 implied lower fitted hazard, not a corresponding change in survival probability. At discovery FDR < 0.05, gene counts were BRCA 10, COAD 21, GBM 0, HNSC 537, KIRC 9,852, LUAD 1,316, LUSC 0, OV 0, PAAD 4,163 and UCEC 1,593. Especially broad discovery in KIRC, and absent discoveries in some smaller or differently censored cohorts, cannot be equated with true numbers of biomarkers: correlated genes, clinical covariates, model assumptions and event availability all influence these counts.
Figure 3. Ten cancer-specific genome-wide Cox association panels. The horizontal axis shows actual HR = exp(coefficient) per within-cancer expression SD on a logarithmic scale (reference HR = 1); the vertical axis shows -log10(raw P). Discovery colouring reflects cancer-specific BH-FDR < 0.05, while gene labels identify selected examples.
The disparity in discovery yield raised a sharper question than which cancer had the most significant genes: do particular transcripts share adverse or favourable effects across malignancies? We therefore compared their direction, effect size and evidentiary status across cancers rather than ranking genes by HR alone. A curated 36-gene matrix broadens the display beyond the highest-profile candidates without implying that those genes were selected independently of the survival data.
Figure 4. Selected 36-gene by ten-cancer survival association matrix. Colour encodes signed log(HR), symbol area encodes absolute log(HR), and symbols differentiate discovery-FDR-significant, tested nonsignificant and unavailable associations. The selection is exploratory, not a clinically validated panel.
Shared Effects And Cancer-Specific Survival Heterogeneity
A common gene effect does not imply a common baseline survival experience. We therefore used cancer-stratified Cox models to allow different baseline hazards and formally compared cancer-specific effects. Among selected associations, SERPINE1 had an adjusted fixed-effect meta-analytic HR of 1.197 (95% CI 1.137-1.262), adverse directions in all ten cancers and reported I² = 0%. This supports directional consistency within the fitted analyses, not identical biological action, absence of all heterogeneity or independent biomarker validation.
Figure 5. SERPINE1 cancer-specific adjusted hazard ratios with 95% confidence intervals and the labelled fixed-effect summary. The HR = 1 reference and cancer-level uncertainty remain visible.
Not all genes behaved consistently. PGK1 showed an adjusted HR of 1.520 in BRCA but 0.774 in KIRC, illustrating opposite estimated directions. This contrast motivates examination of formal heterogeneity and uncertainty rather than assuming a point-estimate difference proves tumour-specific mechanism. Differences in malignant-cell state, stromal composition, subtype and clinical characteristics are plausible explanations that bulk RNA alone cannot separate.
Figure 6. Selected gene-effect heterogeneity across cancers. A zero-centred heatmap shows signed log(HR) and discovery significance; PGK1 illustrates context-dependent directions. I² annotations are descriptive heterogeneity estimates, not gene-significance tests.
Clinical Adjustment Identifies Conditional Associations, Not Validated Markers
Because univariable associations can reflect disease stage or other measured prognostic factors, we refitted selected genes with available cancer-appropriate clinical covariates, including usable stage information. MET in PAAD retained an adjusted HR of 2.247 (95% CI 1.670-3.024), STX1A in KIRC an HR of 1.603 (95% CI 1.415-1.815), and DKK1 in LUAD approximately 1.498. These are continuous-expression estimates on a within-cancer standard-deviation scale. Covariate completeness, residual confounding and prior gene selection still limit generalisation; a large HR alone does not establish predictive value.
Figure 7. Selected clinically adjusted gene-cancer hazard ratios and 95% confidence intervals, including MET-PAAD, STX1A-KIRC, DKK1-LUAD and the opposing PGK1 associations. DKK1 is flagged for non-proportional hazards.
From Model Effects To Observed Overall-Survival Curves
An adjusted continuous-expression HR and a median-split Kaplan-Meier contrast estimate different quantities. We therefore used three descriptive survival figures with explicit expression cutoffs, censoring, uncertainty bands and risk tables, rather than treating visual separation as independent validation. None of the cutoffs constitutes an established clinical threshold.
In PAAD, MET expression was split at 11.480. Lower expression comprised 87 patients and 30 deaths; higher expression comprised 90 patients and 63 deaths. The higher-expression group showed lower observed survival through much of follow-up, consistent in direction with the separately estimated adjusted continuous-expression HR 2.247. Because the same cohort informed discovery, the curves corroborate the visual pattern within this dataset, not external reproducibility.
Figure 8. MET expression and PAAD overall survival. Kaplan-Meier curves compare lower (87 patients, 30 deaths) and higher (90 patients, 63 deaths) expression, with 95% confidence bands, censoring marks and numbers at risk. The annotated adjusted HR derives from continuous-expression Cox modelling, not the median-split comparison.
COAD supplied a deliberately contrasting setting: 432 patients, 97 deaths and only 21 genome-wide discoveries. The ATP6V1B1 display used a median of 1.900, separating 215 lower-expression patients (33 deaths) from 217 higher-expression patients (64 deaths); its annotated adjusted continuous-expression HR was 1.700 (95% CI 1.398-2.068). The visible survival separation is interpretable, but ATP6V1B1's membership among the 21 FDR discoveries, selection procedure and model diagnostics remain to be confirmed from the saved source tables before elevating its evidentiary status.
Figure 9. ATP6V1B1 and COAD overall survival, with confidence bands, censoring marks and risk table. The adjusted continuous-expression HR is separate from the descriptive median-split curves; discovery-selection status requires source-table confirmation.
KIRC provided a third setting with 531 patients and 175 deaths. At STX1A median expression 5.070, the lower group contained 259 patients (56 deaths) and the higher group 272 patients (119 deaths). Their observed survival difference was consistent with the adjusted continuous-expression HR 1.603, yet remained an internally selected association rather than validated risk stratification.
Figure 10. STX1A and KIRC overall survival. Curves show 259 lower-expression patients (56 deaths) and 272 higher-expression patients (119 deaths), with 95% confidence bands, censoring marks and numbers at risk.
Testing Whether A Single Hr Remains Appropriate Over Time
The proportional-hazards assumption cannot be inferred from a low P-value. We examined Schoenfeld residuals, gene-specific and global tests, and influential observations. DKK1 in LUAD illustrated why diagnostics matter: although its adjusted HR was approximately 1.498, its gene-specific PH test was P = 0.00073, making a constant hazard ratio across follow-up questionable. Global violations may also arise from clinical covariates, and influential-case analyses do not justify removing observations merely to strengthen significance.
Figure 11. DKK1-LUAD scaled Schoenfeld residuals against transformed follow-up time, fitted temporal trend and gene-specific PH test. The plot diagnoses temporal variation; it is not an estimated time-varying HR curve.
Do Associated Genes Improve Survival Discrimination?
Statistical association need not improve patient-level prediction beyond a clinical model. Repeated five-fold cross-validation with two repeats therefore compared gene-augmented and clinical-only survival discrimination. A candidate-conditioned arm completed 900/900 comparisons; MET-PAAD improved mean concordance by approximately 0.123 and DKK1-LUAD by 0.078. However, these genes were initially selected using outcomes from the complete dataset, leaving these held-out results vulnerable to selection optimism.
The more defensible training-only feature-selection arm completed 100/100 comparisons. Mean held-out changes in concordance were PAAD +0.068, LUAD +0.030, HNSC +0.020, KIRC +0.011, BRCA +0.005, LUSC -0.003, COAD -0.006, UCEC -0.010, GBM -0.013 and OV -0.022. Thus, the algorithm's added discrimination varied by cancer and was absent or negative in half the cohorts. These internal results establish neither calibration nor external clinical utility; repeated folds also do not constitute independent cohorts.
Figure 12. Training-only, held-out change in C-index by cancer (gene-augmented minus clinical model), centred on zero improvement. Interval meaning must be confirmed from the figure script before identifying it as a confidence interval or empirical variability measure.
From Individual Transcripts To Survival-Associated Biology
Genes do not vary independently in bulk tumours. To ask whether survival associations coalesced into interpretable programmes, we first performed directional ORA using up to 300 FDR-significant adverse or favourable genes against each cancer's tested gene universe, with 100- and 500-gene cap sensitivities. LUAD adverse E2F targets showed 10.73-fold enrichment (FDR 1.15 × 10^-20), and G2/M checkpoint 10.60-fold (FDR 4.23 × 10^-20). PAAD mitotic spindle and G2/M checkpoint had 10.19- and 10.49-fold enrichment, respectively (FDR approximately 5.36 × 10^-20 and 5.57 × 10^-20). These are enrichment statistics, not direct functional measurements.
Because threshold-defined lists can omit coherent weaker associations, we then ranked all eligible genes by signed Cox evidence and performed Hallmark and Reactome GSEA. The same TCGA outcomes underpin both ORA and GSEA, so agreement is methodological corroboration, not independent replication.
Figure 13. Hallmark GSEA heatmap across ten cancers. Signed normalised enrichment scores (NES) encode association direction; significance marks show BH-FDR status for E2F, G2/M, EMT, hypoxia, oxidative phosphorylation and related programmes.
The ranked analysis reinforced adverse proliferation-associated signals in LUAD (E2F NES +3.741; G2/M +3.685) and PAAD (E2F +3.345; G2/M +3.288). It also broadened the story beyond cell cycle: EMT and collagen formation were adversely enriched in eight cancers each, hypoxia and extracellular-matrix organisation in seven, and E2F and G2/M in six. These signatures may reflect malignant transcription, stromal abundance, immune infiltration or combinations thereof. They cannot establish epithelial-mesenchymal conversion, collagen deposition or increased proliferation in particular cells.
Reactome further resolved mitotic checkpoints, DNA replication, chromatid separation and collagen-related processes, notably in LUAD, PAAD and KIRC. Overlapping gene memberships and hierarchical pathway definitions preclude counting related significant terms as separate proven mechanisms.
Figure 14. Representative Reactome programme matrix. Cancer columns and selected pathway rows encode signed NES by colour, gene-set size by glyph area and FDR significance by shape; related pathways are not independent discoveries.
Cancer Context Also Changes Pathway Direction
The apparent prognostic direction of a biological programme was not fixed across malignancies. COAD displayed favourable enrichment for MYC targets V1 (NES -3.527), oxidative phosphorylation (-3.474) and E2F targets (-3.237), whereas proliferative programmes were adversely enriched in LUAD and PAAD. These rankings do not imply that experimentally activating such programmes would improve or worsen survival: subtype, tumour composition, clinical differences and correlated transcripts may drive the associations.
Among pathway-cancer combinations significant by both ORA and GSEA, 219/219 had the same direction. This restricted concordance does not establish independent replication. In addition, exceptionally small GSEA FDR values, reaching approximately 10^-29, remain subject to verification of the final probability algorithm, ranking direction and multiple-testing implementation.
Figure 15. Shared and context-dependent pathway directions across ten cancers. Significant adverse, significant favourable and nonsignificant categories summarise recurrence of EMT, collagen, hypoxia, E2F/G2M and other gene-set associations, not experimentally observed pathway activity.
Biological Synthesis And Conclusion
The central result is not a universal list of prognostic genes. Across ten cancers, SERPINE1 showed consistent adverse association, MET-PAAD and STX1A-KIRC provided substantial adjusted cancer-specific associations, PGK1 demonstrated opposite estimated directions, and DKK1 exposed a time-dependent modelling limitation. Training-only cross-validation then established that predictive gain was conditional on cancer context, while Hallmark and Reactome connected diverse genes to recurrent, yet sometimes oppositely directed, proliferation and tumour-microenvironment-associated programmes.
Interpretation remains constrained by candidate selection, clinical and compositional confounding, PH violations, gene-set dependence, uncertain extreme GSEA probabilities and absent external validation. Accordingly, these transcripts are candidate prognostic associations, not clinically validated biomarkers, and the enriched programmes are hypotheses about tumour biology rather than causal mechanisms. The coherent scientific finding is the coexistence of recurrent and cancer-dependent transcriptomic survival associations, with statistical and biological context essential to their interpretation.